













































by James M. Klas
Indian casinos posted their customary annual new record in 2025 reaching $46.2 billion in gross gaming revenue, according to data published by the National Indian Gaming Commission (NIGC). That total represents an increase of 5.3 percent from 2024. While there continues to be growth in the number of Indian gaming operations, the primary reason for the increase in tribal gaming revenue was year over year growth at existing facilities.
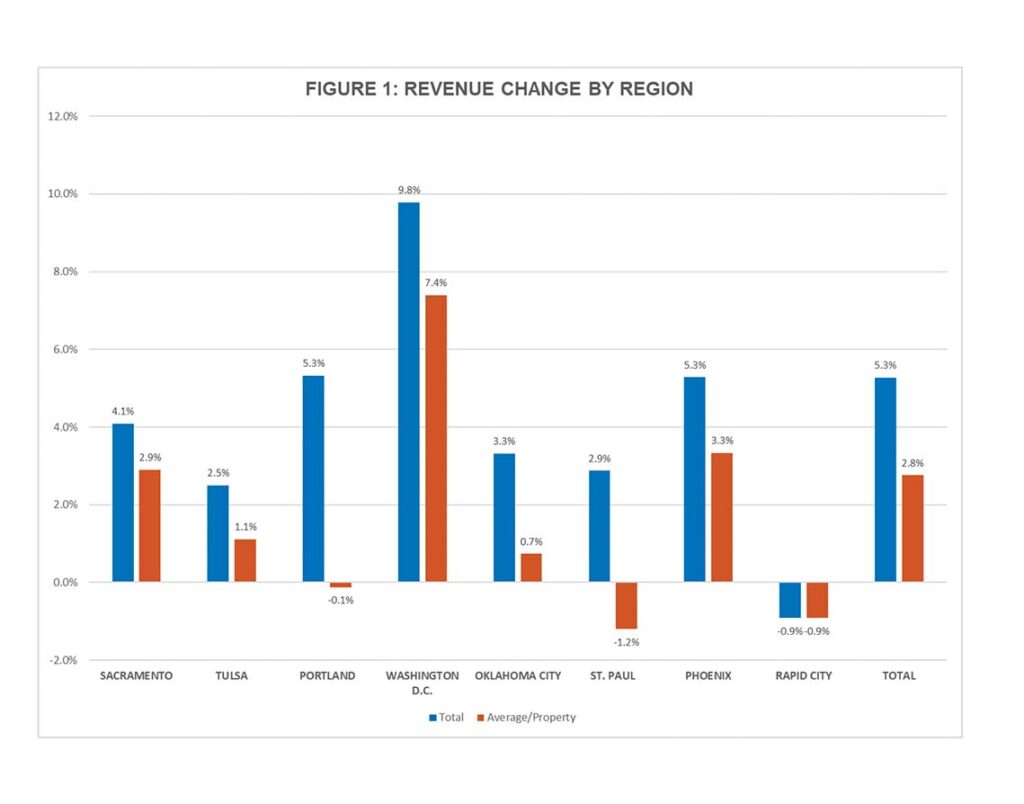
While the overall growth was impressive, it was far from even. One NIGC district, Rapid City, experienced a drop in revenue of nearly one percentage point. Only one district surpassed the overall total by a significant amount. The Washington D.C. district experienced revenue growth of 9.8 percent. Two other regions, Portland and Phoenix, effectively matched the national average with 5.3 percent growth. Since those three regions account for over 44 percent of total Indian gaming revenue, they were able to carry the other regions that had lower growth, including Sacramento, Tulsa, Oklahoma City and St. Paul. In terms of dollars, the Washington D.C. district had the greatest revenue increase at effectively $1.0 billion over last year. Even though Sacramento had a lower than average percentage growth rate at 4.1 percent, it has the second highest dollar growth at $495.8 million.
The NIGC received audited financial statements for 545 properties for 2025, an increase of 13 properties from 2024. Every region except Rapid City added at least one property last year, with the St. Paul district adding the most at four properties. Portland and Oklahoma City also added more than just one property last year. Rapid City alone was unchanged. No region lost properties last year.
As suggested above, even with the increase in properties across nearly every district, average revenue per property increased in most of them as well. Rapid City declined, of course, with no new properties and a decline in revenue, but only by just under one percentage point. Total revenue growth in the Portland district fell just short of the growth in properties so that average revenue per property fell barely, only approximately one-tenth of one percent. Average revenue per property in the St. Paul district fell the most at 1.2 percent, even though it had growth in total revenue. It simply was not enough to keep pace with the number of new properties added in that region. All of the other districts experienced increases in average win per property, as well as in total properties, led by the Washington D.C. district with average revenue per property growth of nearly 7.4 percent. Nationwide, Indian casinos experienced an average 2.8 percent growth in revenue per property. Figure 1 shows the percentage changes in total gaming revenue and average per property by region from 2024 to 2025.
Figure 1
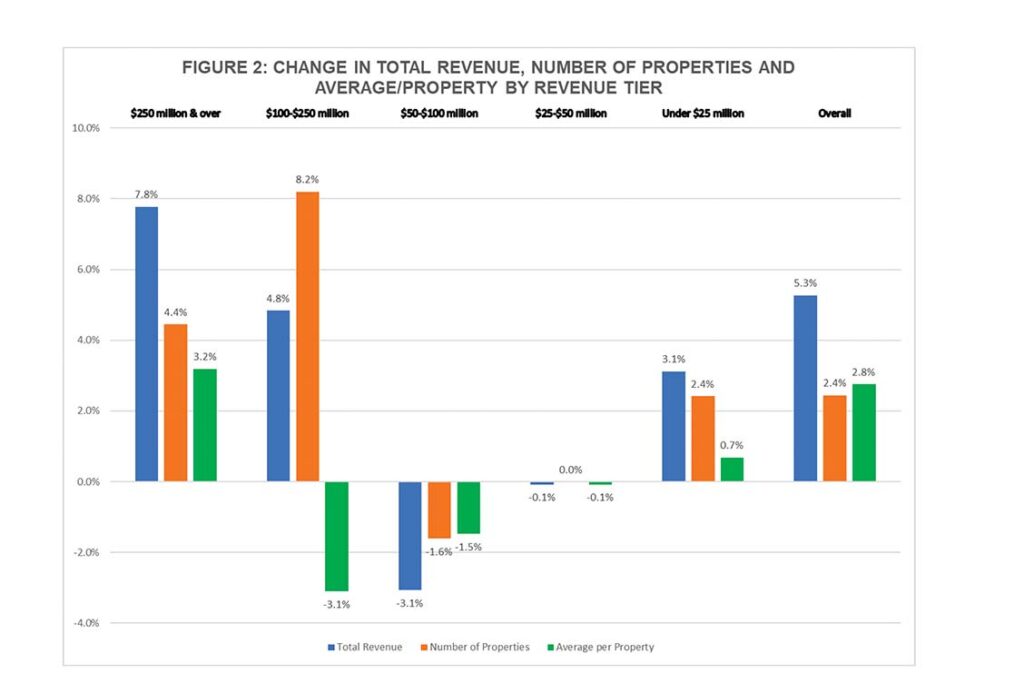
The NIGC also provides information on industry-wide performance by gaming revenue bracket. The top revenue bracket, $250 million or more, showed an increase of 7.8 percent in total gaming revenue over 2024, with an increase in total properties of 4.4 percent and an increase in average per property of 3.2 percent. The next bracket down, $100-$250 million, had an increase in total gaming revenue of 4.8 percent, but an average per property that fell 3.1 percent due to an 8.1 percent increase in the number of properties in that group. The $50-$100 million bracket was the only one that experienced across the board declines in total revenue, total properties and average per property. The $25-$50 million bracket remained virtually unchanged from 2024. The lowest revenue bracket, below $25 million, showed modest increases across the board. Figure 2 shows year-over-year changes by gaming revenue tier.
Figure 2
The economy remains as unpredictable, if stubbornly resilient, as it was at this time last year. Supreme Court tariff decisions and the departure of Chairman Powell have been balanced by new methods for imposing at least some tariffs and by the effects of the Iran war, stalling expectations for interest rate cuts. On September 16, the Federal Reserve raised interest rates by .25%, despite President Trump’s handpicked successor as Fed Chair. There are signs that declines in foreign tourism, particularly Canadian visitors, and higher gas prices are starting to affect potential demand from outside of local markets. However, spending within local markets seems to be holding up. It seems that it will take a more serious shock to the economy to disrupt consumer spending beyond the margins. While it is possible to theorize what shocks could plausibly occur, there are none that stand out as both severe enough and likely enough to lead to a firm expectation of a more comprehensive disturbance.
As we are already two-thirds of the way through 2026 with no major changes to the economy, good or bad, a continuation in the pattern of the last two years is the best bet. If major civil and political disruptions occur around and after the mid-term elections, that could still have a negative effect on revenue potential. However, there is no guarantee that any significant disruptions will occur, either due to the results or attempts to alter them one way or the other. The well publicized battle over the legality and reach of “prediction markets” could ultimately alter the landscape, but not quickly enough to distort 2026 performance at the national level. Lacking those things, or some other unforeseen shock, it is reasonable to assume that when we write about NIGC figures next year, many of the themes and results will be in line with what we have seen for the past two or three years.
James M. Klas is Co-Founder and Principal of KlasRobinson Q.E.D., a national consulting firm specializing in the economic impact and feasibility of casinos, hotels and other related ancillary developments in Indian Country. He can be reached by calling (800) 475-8140 or email [email protected].