


by James M. Klas
The NIGC recently announced its annual revenue figures for Indian gaming for the prior year. Indian gaming captured $40.9 billion dollars in gaming win in 2022, up 4.8 percent 2021. After the exceptionally strong recovery last year from the impact of the COVID-19 pandemic, it is encouraging to see continued growth in the industry and the crossing of yet another milestone at $40 billion.
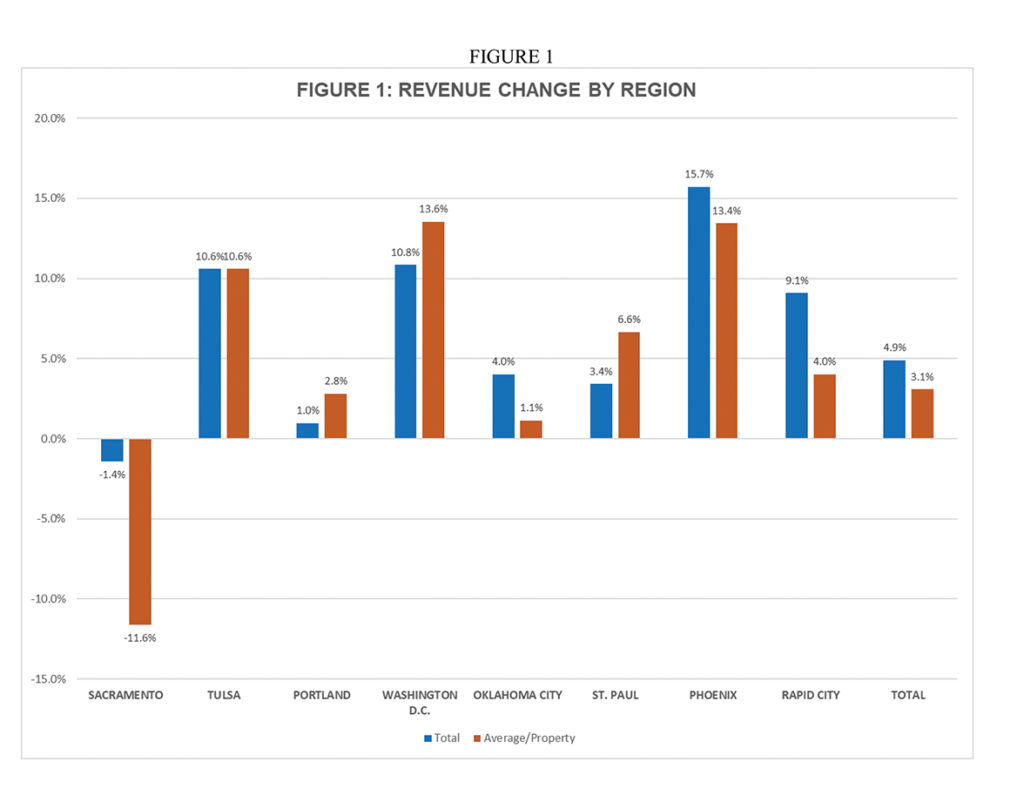
Leading the pack in terms of percentage growth this year was the Phoenix region with an increase of 15.7 percent, followed by the D.C. region at 10.8 percent and the Tulsa region at 10.6 percent. In terms of absolute dollars, the D.C. region had by far the biggest gain at nearly $880 million. Only one region, Sacramento, experienced a decline from 2021.
The decline of 1.4 percent cost the casinos in that region a total of nearly $168 million.The decline in total revenue in the Sacramento came despite an increase in the number of gaming operations in that region by nine properties. As a result, the average win per property in the Sacramento region fell by an even larger 11.1 percent from 2021. Other regions that added operations in 2022 included Oklahoma City, Rapid City and Phoenix. St. Paul, D.C. and Portland also lost properties in 2022. Tulsa remained unchanged. The largest increases in average revenue per property occurred in the D.C., Phoenix, Tulsa and St. Paul regions. No region, other than Sacramento, had a decline in average revenue per property. Figure 1 shows changes in total revenue and average per property by region for 2022.
Comparing changes by revenue range is complicated by the fact that the NIGC has chosen to provide less detailed information in this year’s report than in the past. Up through 2021, they provided a table with clear figures for number of properties by revenue range, total revenue for that range, and both the mean and median for each range. For 2022, they have only provided a graph showing the percentage of total properties and percentage of total revenue for each range, rounded to the nearest whole percentage point, with no discussion of means, or medians. They also combined the bottom three revenue ranges into a single range for 2022. It is possible to impute the number of properties in each category and the total and average revenue for each category from the information provided, but with a margin for error given the rounded percentages rather than actual counts or totals.
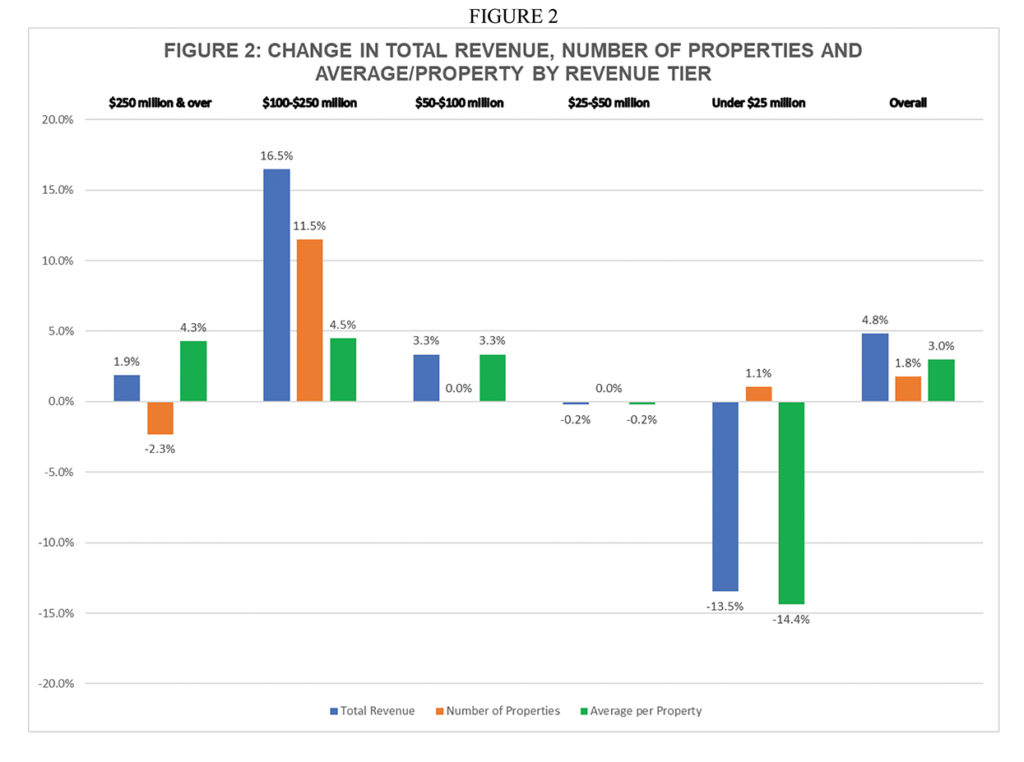
Nine new properties were added in 2022 to the total number of Indian gaming operations tracked by the NIGC. Based upon the percentages they report, it appears that the biggest increase in number of properties occurred in the $100-$250 million revenue range. However, it is impossible to tell if that is due to actual new properties or movement between ranges of existing properties. The bottom revenue range, now “under $25 million,” also increased by three from the previous year. The top revenue range, “over $250 million,” decreased by one, likely due to one property near the bottom of the range dropping down. The other ranges appear to have the same number of properties as in the previous year.
The top three revenue ranges all experienced an increase in average revenue per property compared to 2021 in the three to four percent range. The bottom two tiers experienced declines in average win per property. In particular, the average revenue per property for the newly aggregated under $25 million tier dropped over 14 percent. This is most likely caused by a combination of new small properties being added and of some of the best performing in that range moving up to the next level. In absolute terms, the same pattern appears, with the top three ranges showing increased total revenue and the bottom two showing declines. By far the largest increase, both on a percentage basis and in absolute dollar term, occurred in the $100-$250 million range. Figure 2 presents changes in total revenue, number of properties and average revenue per property by revenue tier as published by the NIGC.
The pressures faced by the industry in 2022, inflation and an exceptionally tight labor market have gradually begun to moderate this year. However, neither has disappeared completely. To this point the Federal Reserve has done an admirable job of managing the money supply to bring down inflation without sending the economy into a tailspin. The mild recession we and many others anticipated for late summer has not materialized. This is due in large part to continued optimism on the part of business leaders and consumers, at least in terms of their spending decisions, if not always in terms of their survey responses. However, there remains a real risk of a recession late this year or early next. It appears that it will be mild if it occurs at all and relatively short lived, less than 12 months. At this point, it is unlikely that any downturn will prevent another increase in industry revenue for 2023 as a whole. For 2024, gaming revenue trends remain hard to predict, although the outlook is slightly more optimistic than it was six months ago.
James M. Klas is Co-Founder and Principal of KlasRobinson Q.E.D., a national consulting firm specializing in the economic impact and feasibility of casinos, hotels and other related ancillary developments in Indian Country. He can be reached by calling (800) 475-8140 or email [email protected].
