


by Matthew S. Robinson
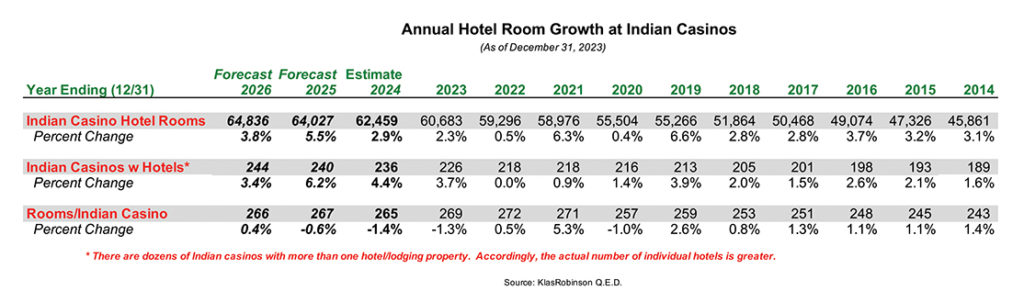
As of December 31, 2023, there were 226 Indian casinos with hotel properties with a combined total of 60,683 rooms – an average of 269 rooms per casino with a hotel. Following 2022, a year of delays due to supply chain and related post-pandemic issues, 2023 was a year of catch up and continued recovery for hotels at Indian casinos. Table 1 presents the historic, estimated and forecast number of hotel rooms at Indian casinos with hotels.
Table 1
In March 2023, the Pokagon Band of Potawatomi Indians celebrated the opening of its 300-plus unit hotel at Four Winds South Bend in Indiana. In April, the Cowlitz Indian Tribe opened its almost 300-unit hotel at ilani Casino Resort in Ridgefield, WA. Also in April, the Wyandotte Nation celebrated the grand opening of its 70-unit Winds Hotel at Crosswinds Casino in Park City, KS – the former Motel 6 property it acquired in 2021 adjacent to its casino and which has since been completely renovated. In May, Red Hawk Casino in Placerville, CA opened its more than 150-unit hotel; the Chickasaw Nation opened its West Bay Casino & Resort in Kingston, OK; and Northern Quest Resort & Casino in Airway Heights, WA opened its new River Tower. In September, the 100-plus unit Wyndham Garden Hotel opened at Coyote Valley Casino in Redwood Valley, CA. In December, Akwesasne Mohawk Casino Resort in Hogansburg, NY, acquired the adjacent Comfort Inn & Suites, re-opening it as the Players Inn. Also in 2023, the Osage Nation in Oklahoma opened its all new Osage Casino and Hotel – Pawhuska with almost 50 units in October and its all new Osage Casino and Hotel – Bartlesville with 100-plus units in November.
In 2024, 10 new Indian casino hotels and one hotel expansion are anticipated to commence operations, adding almost 1,800 rooms with combined project costs of more than $1.5 billion. During 2025, four new Indian casino hotels and four hotel expansions at existing Indian casinos are anticipated to commence operations, adding almost 1,600 rooms with combined project costs of well over $2 billion. And in 2026, another four new Indian casino properties with hotels and two hotel expansions at existing Indian casinos are anticipated to commence operations, adding more than 800 rooms with combined project costs in excess of $1 billion.
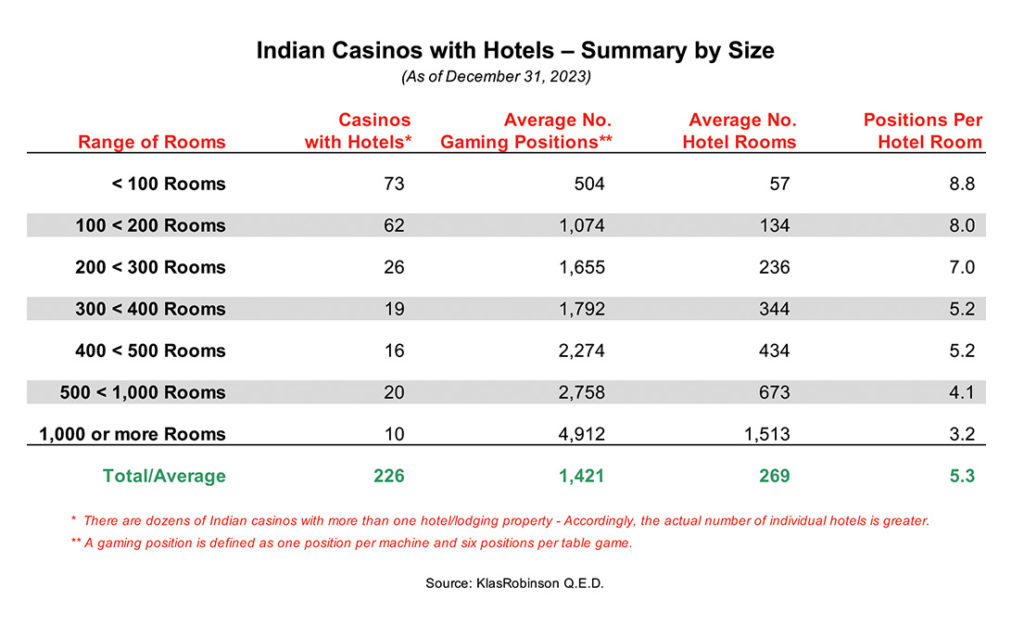
The number of Indian casinos with hotels varies significantly by number of rooms per property. As presented in Table 2, of the 226 Indian casinos with hotels in operation by the end of 2022, the largest segments by size are made up of those with less than 100 rooms (70 properties) and those with between 100 and 200 rooms (60 properties). With respect to the number of gaming positions per hotel room by size segment, the ratio ranges from 3.2 to 8.8, with the general pattern being smaller properties with higher ratios, larger properties with smaller ratios – the average overall ratio of gaming positions per hotel room being 5.3 gaming positions per hotel room.
Table 2
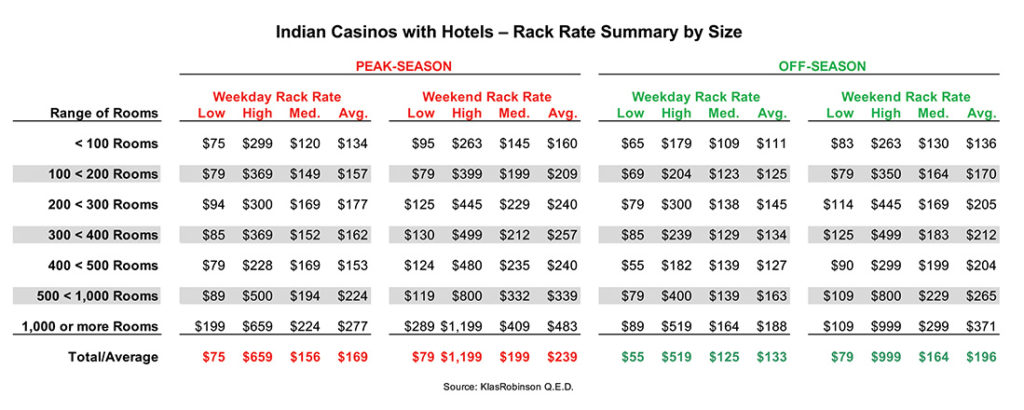
While occupancy rates and actual realized average daily room rates are not published for Indian casinos, advertised room rates or “rack rates” for Indian casino hotels are available. Table 3 shows rack rate data for Indian casino hotels using the same size breakdowns as in the previous table.
Not surprisingly, rack rates are higher for weekends during both peak season and off-season when casino hotels are generally full, compared to weekdays when occupancy levels can vary greatly. There is also a general trend toward higher rates at larger hotels. This is due in part to the typically broader range of facilities and amenities available in a larger hotel. However, the overall strength of demand for casino lodging and the casino itself also affects rates. This explains variations in the middle tiers by size shown in the table where smaller size tiers show somewhat higher maximum and average rack rates than the next size tier above them. It also explains why the gaps in rack rates shrink considerably between the different size tiers during off-peak periods when demand is lower.
Table 3
It is important to remember that the rack rates listed in the table are not the same as the average daily room rates actually paid at the hotels. The most significant factor affecting the difference between rack rates and average rates in casino hotels is the percentage of comp rooms for high value gamers, which can range from under 25 percent to over 75 percent depending upon the market and size of property. Where the comp percentage is higher, the actual average rate is lower, since the rate paid by the casino department to the hotel department for comped rooms is set by management at some reasonable lower level than full rack rate to maintain the validity of cost and profit percentages in both the casino and the hotel. Other factors affecting the difference between rack and average rates include other special discounts and promotions, and seasonal and daily rate adjustments to manage yield.
Matthew S. Robinson is Co-Founder and Principal of KlasRobinson Q.E.D., a national consulting firm specializing in the feasibility and economic impact of casinos, hotels, and other related ancillary developments in Indian Country. He can be reached by calling (800) 475-8140 or email [email protected].
