


by Matthew S. Robinson
As of December 31, 2022, there were 218 Indian casinos with hotel properties with a combined total of 59,296 rooms – an average of 272 rooms per casino with a hotel. Following a record increase in the number of new hotel rooms at Indian casinos in 2021 (almost 3,500 rooms), it appears 2022 was a year of delays due to supply chain and related post-pandemic issues, resulting in numerous project openings being pushed back to 2023 and beyond. Table 1 presents the historic, estimated and forecast number of hotel rooms at Indian casinos with hotels.
Table 1
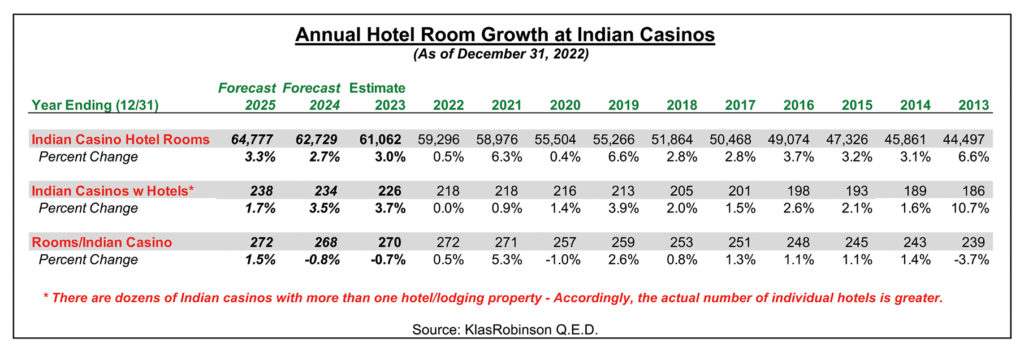
2022 openings included the 205-unit second hotel tower at Gila River Resorts & Casinos – Wild Horse Pass in Chandler, AZ in January; the all-new Table Mountain Casino Resort near Friant, CA with its 171-unit hotel in July; and the November opening of the 74-unit hotel expansion at Prairie Band Casino & Resort in Mayetta, KS. Also, during 2022, several properties had yet to re-open their full complement of rooms, while one of the smaller tribally-owned hotel properties discontinued casino gaming – at least temporarily.
Due to the delays of 2022, it is anticipated eight new Indian casino hotels and two hotel expansions at existing Indian casinos will commence operations in 2023, adding almost 1,800 rooms with combined project costs of more than $750 million. During 2024, it is anticipated another eight new Indian casino hotels and two hotel expansions at existing Indian casinos will commence operations, adding more than 1,650 rooms with combined project costs of well over $1 billion. And in 2025, it is anticipated an additional four new Indian casino properties with hotels and three hotel expansions at existing Indian casinos will commence operations, adding more than 2,000 rooms with combined project costs in excess of $1.5 billion – barring significant economic downturn and/or 2024 election turmoil.
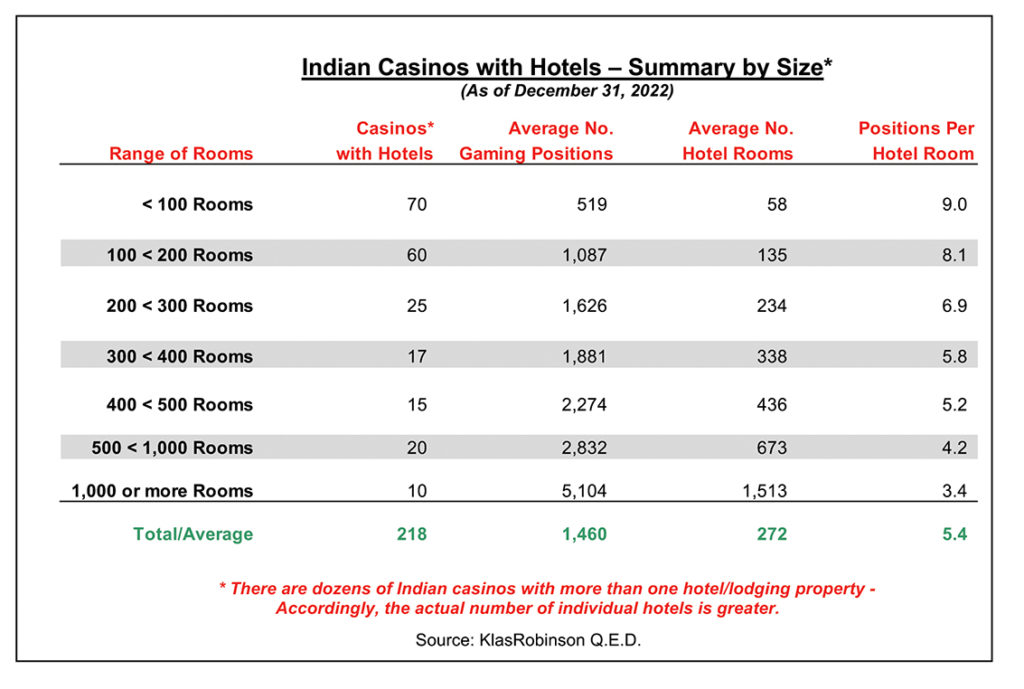
The number of Indian casinos with hotels vary significantly by number of rooms per property. As presented in Table 2, of the 218 Indian casinos with hotels in operation by the end of 2022, the largest segments by size are made up of those with less than 100 rooms (70 properties) and those with between 100 and 200 rooms (60 properties). With respect to the number of gaming positions per hotel room by size segment, the ratio ranges from 3.4 to 9, with the general pattern being smaller properties with higher ratios, larger properties with smaller ratios – the average overall ratio of gaming positions per hotel room being 5.4 gaming positions per hotel room.
Table 2
Indian casinos offer a diverse array of meeting and function spaces, ranging from conference centers and traditional ballrooms to more unique settings such as nightclubs and entertainment venues, lavish pool areas and event lawns, some of the best golf course facilities in the country and even a passenger yacht – to name a few.
For the purpose of the following discussion, meeting and function space includes only dedicated on property spaces, capable of accommodating meetings (theater or classroom-style), receptions (standing or cocktail rounds) and banquets (round tables with or without buffet).
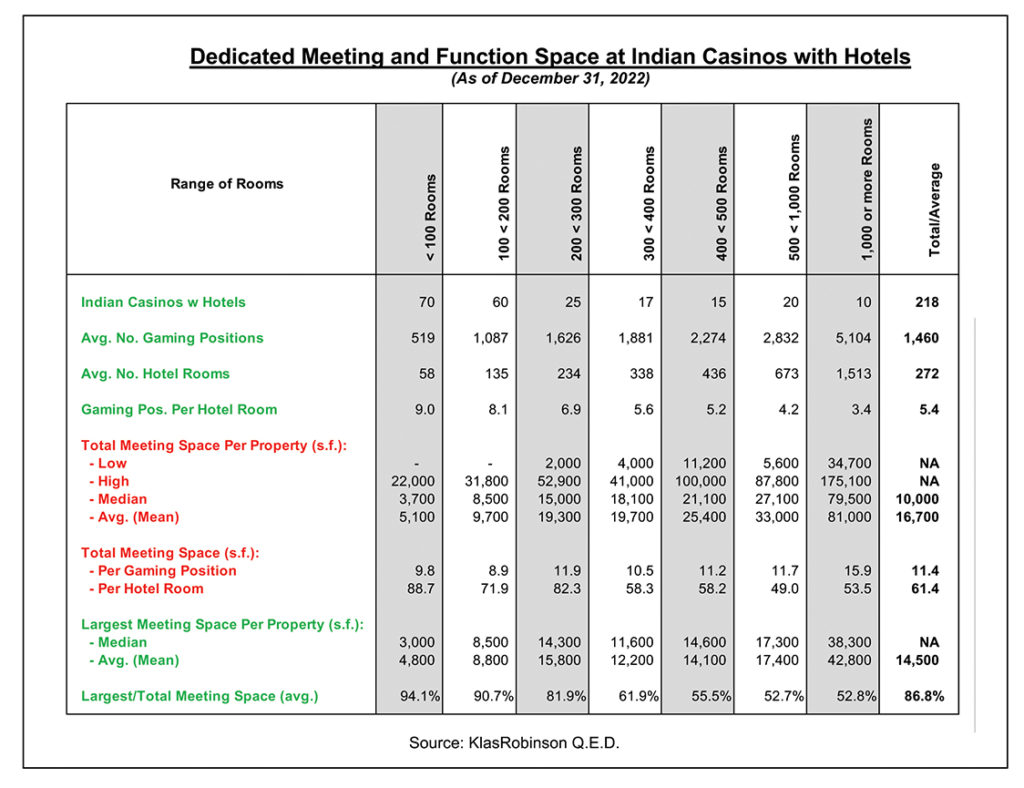
As of December 31, 2022, the 218 Indian casinos with hotels had a combined total of more than 3.5 million sq. ft. of on-site, dedicated meeting and function space with an overall median of 10,000 sq. ft. and average (mean) of 16,700 sq. ft. of meeting and function space per property. On a per gaming position basis, the overall average on-site, dedicated meeting and function space equaled 11.4 sq. ft. per gaming position. On a per hotel room basis, the overall average on-site, dedicated meeting and function space equaled 61.4 sq. ft. per hotel room.
Table 3 presents a summary of dedicated meeting and function space by hotel room range segment at Indian casinos. Similar to hotels at Indian casinos, the specific utilization of meeting space at hotels at Indian casinos is as much a function of marketing and planning to maximize casino demand as it is of supply and demand. As presented in the preceding table, the general trend with respect to size is that the larger the casino (number of gaming positions), the greater the amount of total meeting space. The same can be said for the number of hotel rooms in relation to meeting square footage – the greater the number of hotel rooms at an Indian casino, the greater the total amount of meeting space.
Table 3
In the wake of Covid, meeting and function space utilization is still recovering. In fact, there are still a half dozen Indian casinos with hotels that have yet to re-open their banquet and conference facilities. This is due to a variety of factors including labor shortages, as well as concerns related to the uncertainty associated with the lag time and pre-booking of events. Most of us still remember the conferences and conventions that were scheduled, rescheduled and/or cancelled altogether during the various phases of the pandemic. This fact is also not lost on property design, with the meeting and function space allocation for planned casino hotels not only being revisited, but in some cases reduced.
At the same time, another lesson learned from the past several years is that while virtual meetings and video conferences can provide a convenient alternative in certain circumstances, and even a “second-best” option, in many cases they are still no substitute for an in-person event.
With respect to future meeting and function space development, the key will continue to be the design of flexible spaces with the ability to accommodate multiple types and sizes of events in order to maximize overall facility utilization.
Matthew S. Robinson is Co-Founder and Principal of KlasRobinson Q.E.D., a national consulting firm specializing in the feasibility and economic impact of casinos, hotels, and other related ancillary developments in Indian Country. He can be reached by calling (800) 475-8140 or email [email protected].


